
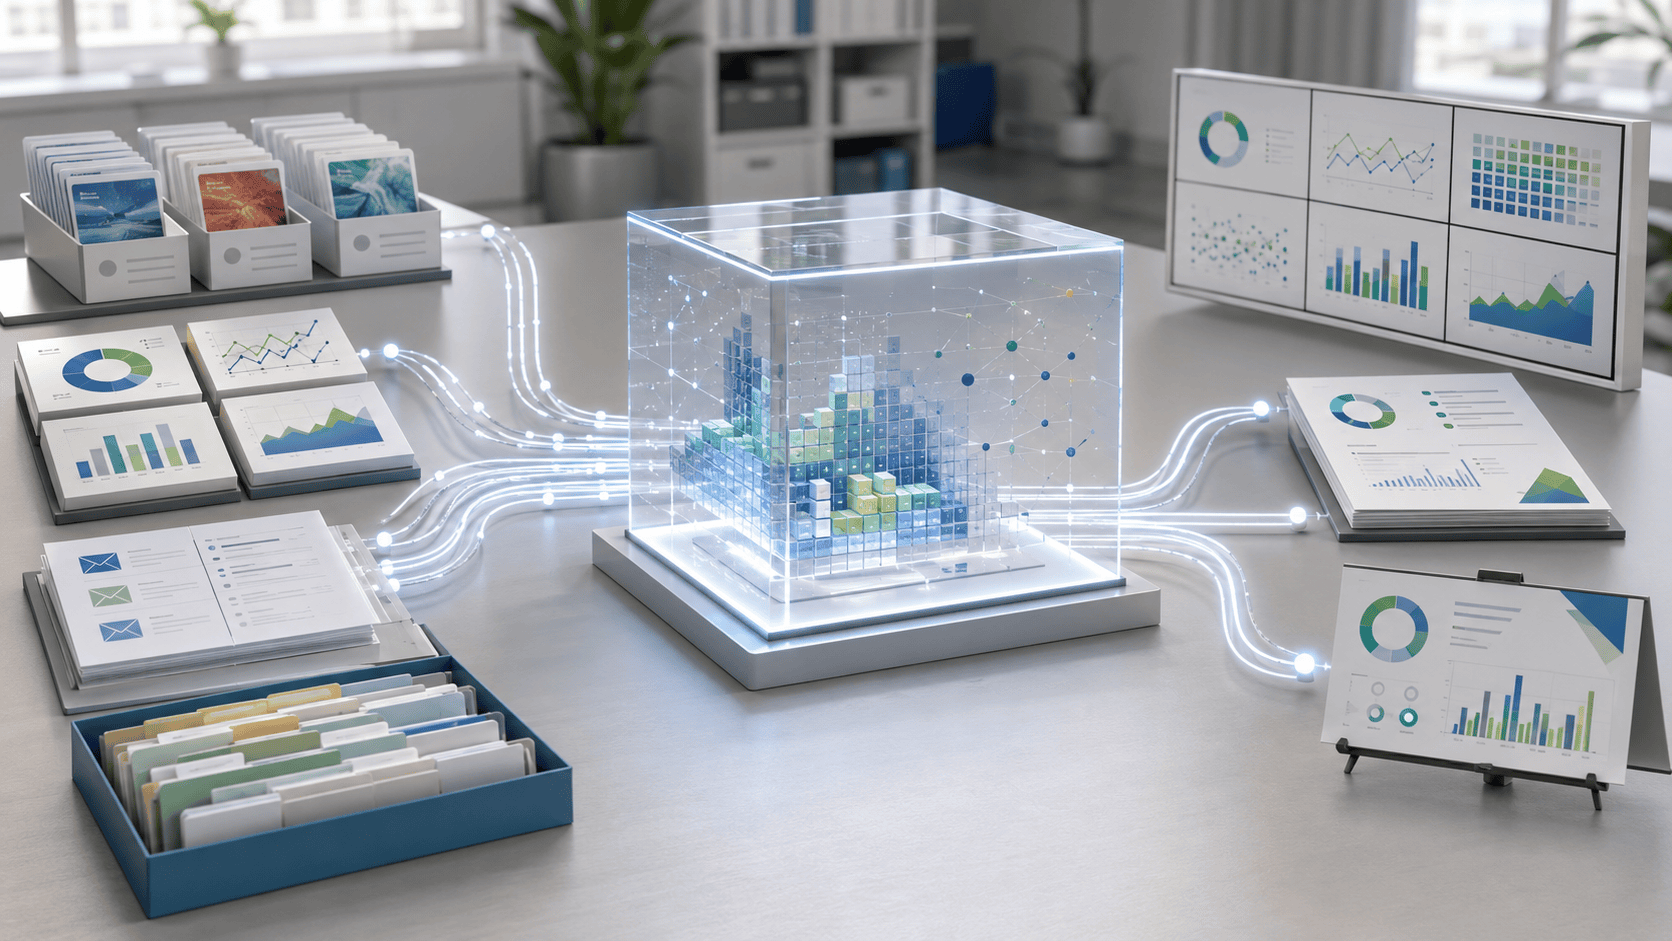
Most teams do not struggle with reporting because they lack data. They struggle because the data lives in too many places, arrives in too many formats, and requires too much manual interpretation before anyone can use it.
A campaign manager may have ad spend in one platform, web activity in another, email performance in a third, CRM activity somewhere else, and fundraising or operational records in a system with its own naming rules. By the time those exports become a deck, spreadsheet, dashboard, or board report, the team has often spent more energy assembling the report than discussing what the report means.
ReportWerks is built for that reporting gap. It gives nonprofits, agencies, and marketing teams a connected reporting workspace where approved source data can become organized dashboards, useful summaries, AI-assisted analysis, and stakeholder-ready reporting views. The goal is not to replace strategy or judgment. The goal is to give teams a cleaner foundation for seeing what is moving, what needs attention, and what story the data is actually telling.
The reporting problem ReportWerks is designed to solve
Recurring reporting often turns into a quiet operational tax. Someone exports data from advertising platforms. Someone else pulls web analytics. A spreadsheet gets rebuilt. Screenshots get pasted into a slide deck. A number changes after the report has already been reviewed. A stakeholder asks why one platform shows a different total than another. The team loses confidence, not always because the work is poor, but because the reporting process is too fragile.
That fragility usually comes from four common problems:
- Disconnected sources: Campaign, analytics, email, CRM, fundraising, and operations data are reviewed separately instead of as parts of one performance picture.
- Manual rebuilding: Teams recreate the same reporting structure every week or month, which creates room for missed exports, stale charts, and inconsistent formulas.
- Different audiences: Operators need detail, while executives, boards, funders, and clients need a clearer view of outcomes, risks, and next steps.
- Slow interpretation: Even when the numbers are available, teams still need help turning metrics into a usable explanation.
ReportWerks addresses those issues by treating reporting as a workflow, not as a last-minute formatting task.
What ReportWerks does
ReportWerks connects approved reporting sources, imports relevant performance data, organizes that data into dashboards and summaries, and helps teams prepare clearer reports for the people who rely on the work. It is especially useful when a team needs to explain performance across more than one system.
For example, a nonprofit may need to understand how digital advertising, email engagement, donation activity, website behavior, and CRM records relate to a campaign. An agency may need to standardize monthly reporting across client accounts while still preserving each client’s goals and context. An in-house marketing team may need a more consistent way to move from channel metrics to leadership-ready reporting.
Those are not just dashboard problems. They are data operations problems. The value comes from connecting the reporting workflow from source access to interpretation to delivery.
Core ReportWerks functions
1. Connect approved reporting sources
ReportWerks is designed around user-approved connections to the platforms that already hold reporting data. That can include advertising, analytics, email, CRM, fundraising, and operational systems, depending on the accounts and workflows the user authorizes.
This matters because reliable reporting starts with clear source access. Teams should know which accounts are connected, what data is being used, and why that data is needed. A reporting tool should not be a mystery layer. It should make the reporting path easier to understand and easier to validate.
2. Organize imported metrics
Raw exports are rarely ready for decision-making. Field names may be inconsistent. Campaigns may use different naming conventions. Dates, channels, segments, and goals may need to be shaped into a structure that humans can read without scanning rows of disconnected data.
ReportWerks turns imported reporting metrics into organized views that support analysis. Instead of forcing teams to restart from loose exports every month, it creates a reporting foundation that can support recurring questions: What changed? What performed well? Where did spend, engagement, or conversion quality diverge? What needs investigation before the next campaign cycle?
3. Build dashboards and summaries
Dashboards are useful when they help people notice patterns, exceptions, and decisions. They are less useful when they simply display totals without context.
ReportWerks supports dashboards and summaries that help teams move from collected metrics to interpretation. A dashboard may help an operator monitor campaign movement. A summary may help a director understand what changed since the last reporting period. A cleaner reporting view may help a board, funder, or client see the important story without needing access to every platform behind it.
4. Support AI-assisted reporting analysis
AI can be helpful in reporting when it is used for the right job. It should not invent conclusions, replace metric definitions, or hide uncertainty. It can, however, help teams get to a first useful interpretation faster by summarizing trends, surfacing possible questions, and turning structured performance data into a clearer draft explanation.
ReportWerks uses AI-assisted workflows around reporting analysis, summaries, and stakeholder-ready views. The important distinction is that AI is assisting interpretation of reporting data. It is not a substitute for source-system validation, campaign strategy, or human review.
5. Create stakeholder-ready views
Different people need different levels of detail. The person responsible for fixing a tracking issue may need platform-level diagnostics. A leadership team may need a concise explanation of performance, risk, budget movement, and next steps. A client may need a report that connects activity to agreed goals without exposing internal notes or unnecessary operational detail.
ReportWerks helps teams move from operator detail to cleaner presentation-ready reporting. That reduces the amount of manual reformatting required before a monthly meeting, board discussion, funder update, or client review.
Practical use cases
ReportWerks fits several recurring reporting situations where disconnected data slows down decision-making.
Campaign performance reporting: A team can bring together ad platform, analytics, email, CRM, and conversion data to evaluate whether a campaign is producing meaningful engagement rather than isolated channel activity.
Nonprofit fundraising reporting: Fundraising teams can connect giving activity, campaign sources, email engagement, and audience context so reports explain donor behavior more clearly than a donation total alone.
Agency client reporting: Agencies can standardize their reporting workflow across accounts while still making room for each client’s channels, goals, audiences, and performance story.
Leadership and board updates: Digital performance can be translated into cleaner summaries that focus on progress, concerns, and decisions instead of platform-by-platform screenshots.
Operational visibility: Teams can use reporting views to see whether systems are producing the data needed for recurring decisions. When a metric is missing, stale, or inconsistent, that becomes an operations issue worth fixing.
Why this matters beyond the report itself
A better reporting workflow does more than save time. It changes how teams manage digital work.
When reporting is built on connected systems, teams can spot data-quality issues earlier. They can see which platforms need cleaner tracking, better naming conventions, stronger integration rules, or more reliable export processes. They can also reduce the number of private spreadsheets that become unofficial sources of truth.
That is where ReportWerks fits naturally within DigitalWerks’ broader work. DigitalWerks helps organizations plan websites, connect platforms, improve analytics, build integrations, structure data, and automate operational workflows. ReportWerks extends that systems-minded approach into the reporting layer. It helps turn the data moving through those systems into something people can review, explain, and act on.
Implementation considerations
Like any reporting system, ReportWerks works best when the underlying data process is thoughtful. Before connecting sources, teams should clarify a few things:
- Which platforms are the source of truth for each metric?
- Which accounts, campaigns, properties, lists, forms, or records should be included?
- Which identifiers connect activity across systems?
- Which audiences need operator detail, executive summaries, board-ready views, or client-facing reports?
- Which metrics require human review before they are shared?
- Which data should be excluded because it is unnecessary, sensitive, or outside the reporting purpose?
These questions keep reporting aligned with both operational needs and responsible data use. A good reporting workflow should reduce confusion, not create a new black box.
How to validate a ReportWerks reporting workflow
Validation should happen before a report becomes the basis for decisions. A practical review includes:
- Confirm that each connected source is authorized and expected.
- Compare imported metrics against the source platform for a known date range.
- Check whether campaign names, accounts, segments, and dates are mapped consistently.
- Review whether dashboards and summaries match the intended audience.
- Confirm that AI-assisted summaries are reviewed by a person who understands the campaign or operation.
- Document what the report includes, what it excludes, and where the data comes from.
That validation work is not busywork. It is what turns a reporting tool into a reliable operating asset.
ReportWerks and DigitalWerks
ReportWerks is a strong example of how DigitalWerks thinks about digital operations: connect the right systems, structure the data, reduce manual work, and make the result easier for people to use.
The product helps teams move away from scattered exports and recurring screenshot decks toward a more connected reporting process. DigitalWerks’ broader services support the surrounding work: analytics architecture, CRM and fundraising integrations, website tracking, automation, data governance, and the technical implementation needed to make reporting more trustworthy.
If your team is spending too much time building reports and not enough time using them, DigitalWerks can help you review the systems behind the report, identify the data that matters, and decide where ReportWerks fits into a cleaner reporting workflow.